
Introduction: Beyond the Crystal Ball – Making Sense of Financial Futures
Ever stared at a business opportunity, maybe a potential investment or a major strategic shift for your own company, and felt that knot of uncertainty tighten in your stomach? You think it’s a good idea. The potential seems huge. But then the questions start swirling: What’s this really worth? Will it actually make money? How much risk am I taking on? It feels a bit like gazing into a crystal ball, doesn’t it? Hoping for clarity, but mostly seeing fog.
Here’s the good news: you don’t need mystical powers. In the world of finance and business strategy, we have something far more reliable (though maybe slightly less magical-looking). We have financial modeling valuation techniques. That phrase might sound intimidating, maybe conjuring images of complex spreadsheets only Wall Street wizards can decipher. But stick with me. At its core, it’s about building a logical picture of a company’s financial health to understand its value and predict its future performance.
Think of it less like sorcery and more like architecture. You wouldn’t build a skyscraper without a detailed blueprint, right? Financial modeling provides that blueprint for a business. And valuation? That’s figuring out the fair price for the finished structure. Mastering these financial modeling valuation techniques is crucial, whether you’re an entrepreneur seeking funding, an investor sizing up stocks, or a manager making critical financial modeling for business decisions.
This post is your guide to cutting through the jargon. We’ll break down what financial modeling and valuation really mean, explore the core financial modeling valuation techniques professionals use every day, and show you how they provide the clarity needed to make smarter, more confident financial decisions. Forget the crystal ball; let’s build some blueprints.

What Exactly Is Financial Modeling? (Beyond the Buzzwords)
Alright, let’s cut through the jargon. You hear “financial modeling” thrown around a lot, especially in business circles. But what does it actually mean? Simply put, financial modeling is the process of building a numerical representation – usually in a spreadsheet program like Excel – of a company’s financial life. Think of it as translating a company’s operations, its sales, costs, assets, and debts, into the language of numbers.
It’s not just about plugging historical data into a template, though. A good financial model captures the relationships between different financial activities. How do changes in sales affect production costs? How does taking on debt impact future profits? It’s dynamic. It allows you to ask “what if?”
Imagine a flight simulator, but for a business. A pilot uses a simulator to test different scenarios – bad weather, engine trouble – without risking a real plane. Similarly, financial modeling for business decisions allows executives to simulate the potential outcomes of different strategies. What happens if we launch this new product? What if interest rates go up? What if our main competitor slashes prices? A well-built model helps answer these questions with data, not just gut feelings. This simulation capability is a core strength derived from solid financial modeling valuation techniques.
The backbone of most financial models involves the three core financial statements: the Income Statement (showing profitability), the Balance Sheet (a snapshot of assets, liabilities, and equity), and the Cash Flow Statement (tracking cash movements). The real power comes when these are linked together – an integrated model where a change in one area automatically flows through to the others. (Don’t worry, we won’t get bogged down in the accounting weeds here, but understanding this connection is fundamental).
Why bother with all this? Because it’s indispensable for smart decision-making. Need to create a budget? Forecast next year’s revenue? Convince investors to give you capital? Evaluate a potential acquisition? Financial modeling is the tool for the job. It provides a structured way to analyze performance and plan for the future. It’s a critical skill, far more than just knowing Excel shortcuts; it requires understanding the business itself and the financial modeling valuation techniques that bring the numbers to life. It’s about building that financial blueprint we talked about earlier.
The Heart of the Matter: Key Financial Modeling Valuation Techniques
Okay, so you’ve grasped the idea of building a financial model – that digital blueprint of a company. Fantastic! But here’s the million-dollar question (sometimes literally): How do you use that model to figure out what the company is actually worth? You’ve projected the future, simulated scenarios… now what’s the price tag?
This is where valuation comes in. It’s the process of determining the intrinsic or theoretical value of an asset or a company. It’s less about the stock market’s mood swings on any given day and more about the fundamental economic worth. And guess what? There isn’t just one magic formula. Instead, finance pros rely on a toolkit of financial modeling valuation techniques, each offering a different perspective.
Think of it like appraising a unique piece of art. One expert might compare it to recent auction prices of similar artists (like Comps). Another might look at what comparable pieces have sold for in private deals (like Precedent Transactions). And a third might meticulously analyze the artist’s career trajectory and potential future impact to estimate its long-term value (getting closer to DCF). You often need multiple viewpoints for a well-rounded picture.
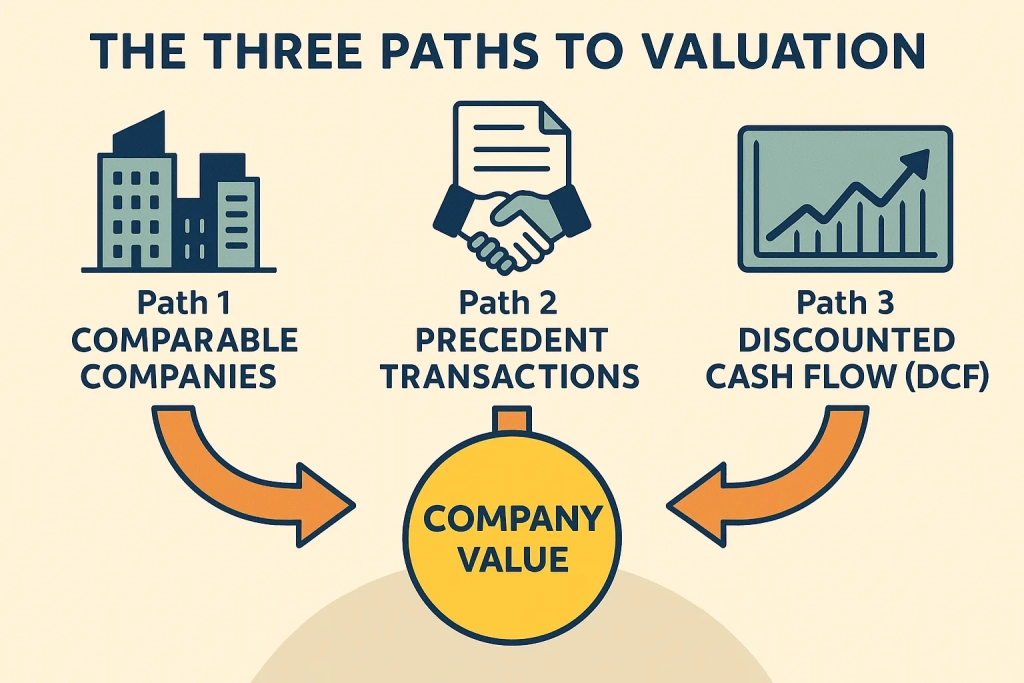
Unpacking Company Valuation Methods Explained: The Big Three
While there are nuances and variations, most valuation work boils down to three core methodologies. Understanding these is fundamental to mastering financial modeling valuation techniques.
A. Comparable Company Analysis (Comps)
This is probably the most intuitive approach. How do you value Company X? Well, let’s see what similar companies (Company A, B, and C) are currently worth in the public market! It’s like pricing your house by looking at recent sales of similar homes on your street.
You find a group of comparable public companies (similar industry, size, growth profile), look at their market values (like stock price or enterprise value), and compare those values to key financial metrics (like earnings, sales, or EBITDA – Earnings Before Interest, Taxes, Depreciation, and Amortization). This gives you valuation multiples (e.g., Price-to-Earnings (P/E) ratio, Enterprise Value-to-EBITDA (EV/EBITDA)). You then apply the average or median multiple from the comparable group to your target company’s relevant metric to estimate its value.
- The Upside? It’s market-based and reflects current investor sentiment. Relatively easy to understand and calculate if good comps exist.
- The Downside? Finding truly comparable companies can be tough. Market sentiment can be fickle and might not reflect true intrinsic value. No two companies are exactly alike.
- Still, it’s a cornerstone of financial modeling valuation techniques used daily in investment banking and equity research.
B. Precedent Transactions
This method is similar to Comps, but instead of looking at current market values of public companies, it looks at the prices actually paid for similar companies in past merger and acquisition (M&A) deals. What did buyers really pay to acquire businesses like the one you’re valuing?
- The Upside? It reflects the price paid to gain control of a company (often includes a ‘control premium’ above the standalone market price). Based on real transactions, not just market fluctuations.
- The Downside? Past transactions might have occurred under different market conditions. Data can be harder to find and might not be perfectly comparable. Deals often have unique circumstances.
- This is another vital tool in the financial modeling valuation techniques arsenal, especially for M&A advisory.
C. Discounted Cash Flow (DCF) Analysis
Ah, the DCF. Often considered the most theoretically sound (and sometimes the most complex) valuation method. Instead of looking sideways at other companies, DCF looks forward, focusing purely on the company itself.
Diving Deep: Understanding Discounted Cash Flow (DCF) Analysis
The core idea behind discounted cash flow (DCF) analysis is simple: a dollar today is worth more than a dollar tomorrow. Why? Because you could invest today’s dollar and earn a return on it. DCF analysis applies this concept to a company’s future earnings power. It estimates the total value of all the cash the company is expected to generate in the future and then translates that future cash into its equivalent value today.
- Project Future Free Cash Flows (FCF): First, you use your financial model to forecast how much cash the business is likely to generate over a specific period (say, 5-10 years). Free Cash Flow is typically the cash available to all investors (both debt and equity holders) after all operating expenses and investments have been paid.
- Calculate the Discount Rate: This is the tricky part. You need a rate that reflects the riskiness of those future cash flows. This is often the Weighted Average Cost of Capital (WACC), which blends the cost of the company’s debt and equity financing, weighted by their proportions.
- Estimate Terminal Value: A company doesn’t just stop existing after 5 or 10 years. You need to estimate its value beyond the explicit forecast period. This is the Terminal Value, often calculated using a perpetuity growth model (assuming cash flows grow at a steady, slow rate forever) or an exit multiple (similar to Comps).
- Discount Everything Back: Using the discount rate (WACC), you calculate the present value of each year’s projected FCF and the present value of the Terminal Value. Summing these up gives you the company’s estimated total value (often Enterprise Value).
- Formula Glimpse: The basic idea is captured by the present value formula: PV = FV / (1 + r)^n, where PV is Present Value, FV is Future Value (like a year’s FCF), r is the discount rate (WACC), and n is the number of years in the future.
- The Upside? It’s based on the company’s fundamental ability to generate cash, not just market sentiment or past deals. Highly flexible for scenario analysis.
- The Downside? It’s highly sensitive to assumptions. Small changes in growth rates, WACC, or terminal value can significantly impact the final valuation. Remember: Garbage In, Garbage Out (GIGO). If your forecasts are wrong, your valuation will be too.
Building the Model: Practical Tips & Considerations
So, we’ve talked about the what (financial modeling) and the why (valuation). Now, let’s touch upon the how. How do these financial modeling valuation techniques actually come together in practice? It’s one thing to understand the concepts, quite another to build a robust, reliable model yourself.
How Do Financial Modeling Valuation Techniques Work in Practice?
- Assumptions are EVERYTHING: Remember our GIGO principle (Garbage In, Garbage Out)? It bears repeating. Your model’s output is entirely dependent on the assumptions you feed it – future growth rates, cost structures, discount rates, etc. These aren’t wild guesses; they should be based on thorough research, historical data, industry knowledge, and logical reasoning. Documenting your assumptions clearly is vital. Why did you pick that growth rate? Justify it!
- Sensitivity & Scenario Analysis are Your Best Friends: The future is uncertain. Period. A single valuation number based on one set of assumptions is fragile. What if sales growth is 10% lower than expected? What if interest rates jump? This is where sensitivity analysis (testing how changes in one key assumption impact the outcome) and scenario planning (modeling different potential futures – e.g., base case, upside case, downside case) become invaluable. They stress-test your model and provide a range of potential outcomes, which is crucial for effective financial modeling for business decisions. It shows you which assumptions really drive the value.
- Keep it Clean and Clear: Ever inherited a spreadsheet that looked like a bowl of spaghetti? Don’t build models like that. Structure matters. Use clear labels, consistent formatting, separate tabs for inputs, calculations, and outputs. Someone else (or even your future self) should be able to understand your logic. A well-structured model is easier to audit, update, and trust. This organizational aspect is an underrated part of applying financial modeling valuation techniques effectively.
- Tailor to the Purpose & Industry: Not all models are created equal. A model for a fast-growing, pre-revenue tech startup will look very different from one for a stable, mature manufacturing company. The key drivers, risks, and relevant financial modeling valuation techniques will differ. For the startup, user growth and market adoption might be key assumptions; for the manufacturer, commodity prices and production efficiency could be paramount. Context is key.
Data-Driven Insights: Where to Find the Numbers (And Why They Matter)
Okay, we’ve established that assumptions are the engine of any financial model, and financial modeling valuation techniques rely heavily on them. But where do these assumptions, these crucial inputs, actually come from? You can’t just pull them out of thin air (well, you can, but your model won’t be worth much!). Reliable data is the bedrock of credible financial modeling and valuation.
Think about it: if you’re projecting future sales growth, you need to look at historical growth, industry trends, competitor performance, and economic forecasts. If you’re estimating costs, you need data on supplier pricing, labor rates, and overheads. And for discounted cash flow (DCF) analysis, you absolutely need solid data to calculate that all-important WACC.
- Company Filings (The Source): For public companies, regulatory filings are goldmines. In the U.S., the SEC’s EDGAR database provides free access to annual reports (10-K), quarterly reports (10-Q), and other crucial filings containing detailed financial statements, management discussions, and risk disclosures. This is primary source material.
- Financial Data Providers (The Aggregators): Companies like Bloomberg, Refinitiv (formerly Thomson Reuters), S&P Capital IQ, and FactSet aggregate vast amounts of financial data, market data, economic data, and research. They are powerful tools but come with hefty subscription fees, typically used by institutional investors and banks.
- Market Research Reports: Industry-specific reports from firms like Gartner, Forrester, or specialized boutique research houses can provide valuable insights into market size, growth trends, competitive dynamics, and customer behavior.
- Economic Data: Government agencies (like the Bureau of Economic Analysis or the Bureau of Labor Statistics in the US) and international organizations (like the IMF or World Bank) publish macroeconomic data essential for forecasting.
Ensuring data integrity is paramount. Using outdated or inaccurate data will undermine even the most sophisticated financial modeling valuation techniques. Always try to cross-reference data from multiple sources if possible.
Now, let’s look at some concrete examples of data used in valuation:
Table 1: Common Financial Ratios Used in Valuation
| Ratio | Formula | What it Generally Tells You |
| Price-to-Earnings (P/E) | Market Price per Share / Earnings per Share | How much investors are willing to pay per dollar of earnings. |
| EV/EBITDA | Enterprise Value / EBITDA | Compares total company value to its operational earnings power. |
| Price-to-Sales (P/S) | Market Cap / Total Revenue | How much investors value each dollar of a company's sales. |
| Price-to-Book (P/B) | Market Cap / Book Value of Equity | Compares market value to the accounting value of equity. |
| Dividend Yield | Annual Dividend per Share / Price per Share | The return an investor gets from dividends relative to price. |
Table 2: Example WACC Calculation Components
| Component | Typical Data Source | Example Input/Consideration |
| Cost of Equity (Ke) | CAPM (Capital Asset Pricing Model) often used | Requires Risk-Free Rate (Govt. Bonds), Beta (Data Provider), Market Risk Premium (Estimate) |
| Cost of Debt (Kd) | Company Filings (Interest Expense / Total Debt), Bond Yields | Reflects the company's current borrowing cost (pre-tax). |
| Market Value of Equity | Stock Market Data (Share Price * Shares Outstanding) | Readily available for public companies. |
| Market Value of Debt | Company Filings (Book value often used as proxy) | Can be complex to estimate precisely for non-traded debt. |
| Corporate Tax Rate | Company Filings, Tax Regulations | Used to calculate the after-tax cost of debt |
Table 3: Comparison of Valuation Methods
| Method | Basis of Valuation | Key Pros | Key Cons |
| Comparable Companies | Market multiples of similar publicly traded companies | Market-based, reflects current sentiment, relatively easy to calculate | Finding true comps is hard, market can be irrational, ignores control premium |
| Precedent Transactions | Prices paid in past M&A deals for similar companies | Based on actual transactions, includes control premium | Data can be scarce/dated, past conditions differ, deals have unique aspects |
| Discounted Cash Flow | Present value of expected future free cash flows | Theoretically soundest (intrinsic), flexible for scenarios, company-specific | Highly sensitive to assumptions (GIGO), forecasting is difficult, complex |
Remember, these tables provide a snapshot. Applying these financial modeling valuation techniques effectively requires digging into the specifics of the company and industry you are analyzing. The data provides the ingredients, but the model and your analysis are the recipe.
Formulas in Financial Modeling
- Present Value (PV): Crucial for discounted cash flow (DCF) analysis. It calculates today’s value of a future sum.
PV = FV / (1 + r)^n- PV = Present Value
- FV = Future Value (e.g., a projected cash flow)
- r = Discount Rate (often WACC)
- n = Number of periods
- Weighted Average Cost of Capital (WACC): Represents a company’s blended cost of capital across all sources.
WACC = (E/V * Re) + [(D/V * Rd) * (1 - T)]- E = Market Value of Equity
- D = Market Value of Debt
- V = Total Market Value of Equity and Debt (E + D)
- Re = Cost of Equity (often found using CAPM)
- Rd = Cost of Debt (company’s borrowing rate)
- T = Corporate Tax Rate (This formula is foundational for the discount rate in DCF)
- Price-to-Earnings (P/E) Ratio: A common multiple used in Comparable Company Analysis.
P/E Ratio = Market Price per Share / Earnings per Share (EPS)(Helps compare valuation relative to earnings) - Enterprise Value (EV): Represents the total value of a company, often used in multiples like EV/EBITDA.
EV = Market Capitalization + Total Debt - Cash and Cash Equivalents(Provides a capital structure-neutral valuation perspective)

Beyond the Numbers: The 'Art' of Valuation
Now, it might be tempting to think that once you’ve mastered the formulas and Excel gymnastics of financial modeling valuation techniques, you’ve cracked the code. Plug in the numbers, get the answer. Simple, right? Well, not quite.
If valuation were purely a mechanical process, we could just hand it over to the computers entirely (and maybe someday we will, but we’re not there yet!). The reality is, there’s an ‘art’ to valuation that complements the science. The numbers tell a story, but you need judgment and experience to interpret that story correctly.
Think about it. Your discounted cash flow (DCF) analysis might spit out a precise value, say $54.32 per share. But that number is built on a foundation of assumptions about the future – a future that’s inherently uncertain. What if a disruptive new competitor emerges? What if consumer tastes shift dramatically? What if a key executive, the visionary driving the company’s success, suddenly leaves? These qualitative factors don’t always fit neatly into a spreadsheet cell, but they can profoundly impact a company’s true worth.
- Understanding Management Quality: Is the leadership team experienced, ethical, and strategically savvy? Or are they prone to missteps? Assessing management is subjective but crucial.
- Gauging the Competitive Landscape: How strong are the company’s competitors? What are the barriers to entry in the industry? Is the company gaining or losing market share? A deep understanding of the competitive dynamics informs the plausibility of your growth forecasts.
- Navigating the Regulatory Environment: Changes in laws and regulations can create significant headwinds or tailwinds for businesses. Think about environmental regulations impacting industrial companies or data privacy laws affecting tech firms.
- Anticipating Technological Disruption: Is the company vulnerable to being ‘Uber-ed’ or ‘Netflixed’? Technological shifts can render entire business models obsolete. Conversely, is the company a disruptor itself?
These qualitative insights directly influence the quantitative assumptions you make within your financial modeling valuation techniques. For instance, a highly competent management team might justify a slightly higher growth rate assumption. A precarious competitive position might warrant a higher discount rate (WACC) to reflect increased risk. Strong intellectual property might support a higher terminal value multiple.
It’s about looking beyond the reported financials to understand the story behind the numbers. Why are margins improving? Is it sustainable efficiency, or a temporary blip? Why is revenue growing? Is it acquiring new customers or just raising prices? This deeper analysis, this blend of quantitative rigor and qualitative judgment, is what separates a basic calculation from a truly insightful valuation. Effective financial modeling valuation techniques are wielded best by those who understand both the math and the market narrative.
Data for Financial Modeling Valuation Techniques: Finding Reliable Numbers (And Why They Matter)
Okay, we’ve established that assumptions are the engine of any financial model, and financial modeling valuation techniques rely heavily on them. But where do these assumptions, these crucial inputs, actually come from? You can’t just pull them out of thin air (well, you can, but your model won’t be worth much!). Reliable data is the bedrock of credible financial modeling and valuation.
Think about it: if you’re projecting future sales growth, you need to look at historical growth, industry trends, competitor performance, and economic forecasts. If you’re estimating costs, you need data on supplier pricing, labor rates, and overheads. And for discounted cash flow (DCF) analysis, you absolutely need solid data to calculate that all-important WACC.
- Company Filings (The Source): For public companies, regulatory filings are goldmines. In the U.S., the SEC’s EDGAR database provides free access to annual reports (10-K), quarterly reports (10-Q), and other crucial filings containing detailed financial statements, management discussions, and risk disclosures. This is primary source material.
- Financial Data Providers (The Aggregators): Companies like Bloomberg, Refinitiv (formerly Thomson Reuters), S&P Capital IQ, and FactSet aggregate vast amounts of financial data, market data, economic data, and research. They are powerful tools but come with hefty subscription fees, typically used by institutional investors and banks.
- Market Research Reports: Industry-specific reports from firms like Gartner, Forrester, or specialized boutique research houses can provide valuable insights into market size, growth trends, competitive dynamics, and customer behavior.
- Economic Data: Government agencies (like the Bureau of Economic Analysis or the Bureau of Labor Statistics in the US) and international organizations (like the IMF or World Bank) publish macroeconomic data essential for forecasting.
Table 1: Common Financial Ratios Used in Valuation
| Ratio | Formula | What it Generally Tells You |
| Price-to-Earnings (P/E) | Market Price per Share / Earnings per Share | How much investors are willing to pay per dollar of earnings. |
| EV/EBITDA | Enterprise Value / EBITDA | Compares total company value to its operational earnings power. |
| Price-to-Sales (P/S) | Market Cap / Total Revenue | How much investors value each dollar of a company's sales. |
| Price-to-Book (P/B) | Market Cap / Book Value of Equity | Compares market value to the accounting value of equity. |
| Dividend Yield | Annual Dividend per Share / Price per Share | The return an investor gets from dividends relative to price. |
Table 2: Example WACC Calculation Components
| Component | Typical Data Source | Example Input/Consideration |
| Cost of Equity (Ke) | CAPM (Capital Asset Pricing Model) often used | Requires Risk-Free Rate (Govt. Bonds), Beta (Data Provider), Market Risk Premium (Estimate) |
| Cost of Debt (Kd) | Company Filings (Interest Expense / Total Debt), Bond Yields | Reflects the company's current borrowing cost (pre-tax). |
| Market Value of Equity | Stock Market Data (Share Price * Shares Outstanding) | Readily available for public companies. |
| Market Value of Debt | Company Filings (Book value often used as proxy) | Can be complex to estimate precisely for non-traded debt. |
| Corporate Tax Rate | Company Filings, Tax Regulations | Used to calculate the after-tax cost of debt. |
Table 3: Comparison of Valuation Methods
| Method | Basis of Valuation | Key Pros | Key Cons |
| Comparable Companies | Market multiples of similar publicly traded companies | Market-based, reflects current sentiment, relatively easy to calculate | Finding true comps is hard, market can be irrational, ignores control premium |
| Precedent Transactions | Prices paid in past M&A deals for similar companies | Based on actual transactions, includes control premium | Data can be scarce/dated, past conditions differ, deals have unique aspects |
| Discounted Cash Flow | Present value of expected future free cash flows | Theoretically soundest (intrinsic), flexible for scenarios, company-specific | Highly sensitive to assumptions (GIGO), forecasting is difficult, complex |
Remember, these tables provide a snapshot. Applying these financial modeling valuation techniques effectively requires digging into the specifics of the company and industry you are analyzing. The data provides the ingredients, but the model and your analysis are the recipe.
Conclusion: Making Smarter Choices with Financial Models
So, there you have it. We’ve journeyed through the landscape of financial modeling and valuation, hopefully demystifying some of the concepts along the way. From understanding the basic structure of a financial model as a business blueprint to exploring the core financial modeling valuation techniques – Comps, Precedents, and the mighty DCF – the goal has been clear: to equip you with a better understanding of how professionals assess business value and make informed financial decisions.
Let’s be honest, diving into financial modeling valuation techniques can feel like learning a new language at first. There are terms, formulas, and nuances that take time and practice to master. But it’s not black magic performed only by Wall Street gurus. It’s a logical, structured approach to understanding a company’s financial health and potential. It’s about replacing gut feelings and crystal ball gazing with data-driven analysis and reasoned judgment – the crucial element in sound financial modeling for business decisions.
Remember, the models themselves are just tools. Their power lies in how they are built (with careful assumptions and clean structure) and how they are interpreted (considering both the quantitative outputs and the qualitative context). The ‘art’ of valuation, understanding the story behind the numbers and the factors that can’t easily be quantified, is just as important as the ‘science’ of the calculations. Effective use of financial modeling valuation techniques blends both.
Looking ahead, the importance of these skills is only likely to grow. In an increasingly complex and data-driven world, the ability to analyze financial information, model scenarios, and make sound valuation judgments is invaluable. While technology and AI will undoubtedly continue to evolve and perhaps automate some aspects of modeling, the critical thinking, strategic insight, and contextual understanding required for effective financial modeling valuation techniques will remain firmly in the human domain (at least for the foreseeable future!).
Don’t be intimidated. Start small. Explore the concepts. Maybe even try building a simple model for a company you follow or even your own personal finances. The journey to mastering financial modeling valuation techniques begins with the first step, and the clarity it brings to decision-making is well worth the effort.